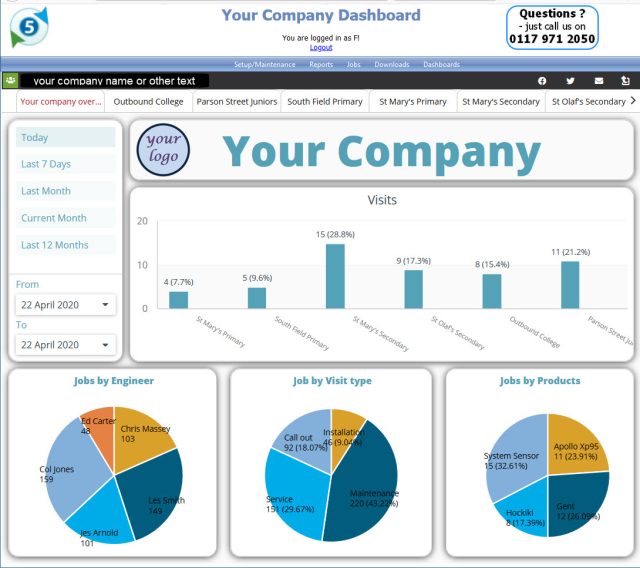

magic5 have been working with ClicData to display results collected on-site in a graphical form.
Give your customers and managers a login so you don’t have to prepare your periodic reports.
Data is usually based on released reports so you can sanity-check the figures first if you like.
Detailed data can be gathered up into a tabbed binder, complete with overview.
Powerful aggregation and transformations means data can be combined and displayed in pretty much any for you like. Such as
- columns,
- bars,
- pies,
- scatters,
- funnels,
- treemaps,
- gauges,
- maps
- and pivot tables.
Interactive graphs are even better
Date selectors give snapshots for the period that matters most to you and your customers – select from the presets or enter specific dates.
Clicking on charts can open data tables for viewing and/or exporting, or lead into further dashboards.
Give us a call (0117 9712050) or email info@magic5software.com to discuss how this might work for you.